📝 Overleaf & LaTeX Guide
Who is this for? Students writing the ECON6083 Final Project report in LaTeX for the first time.
This guide walks you through everything step by step — from creating an account to writing equations and tables.
No prior LaTeX experience needed.
Part 1 — Getting Started with Overleaf
Overleaf is a free, browser-based LaTeX editor. You write LaTeX code on the left and see the compiled PDF on the right — no software installation required.
1
Create a free account
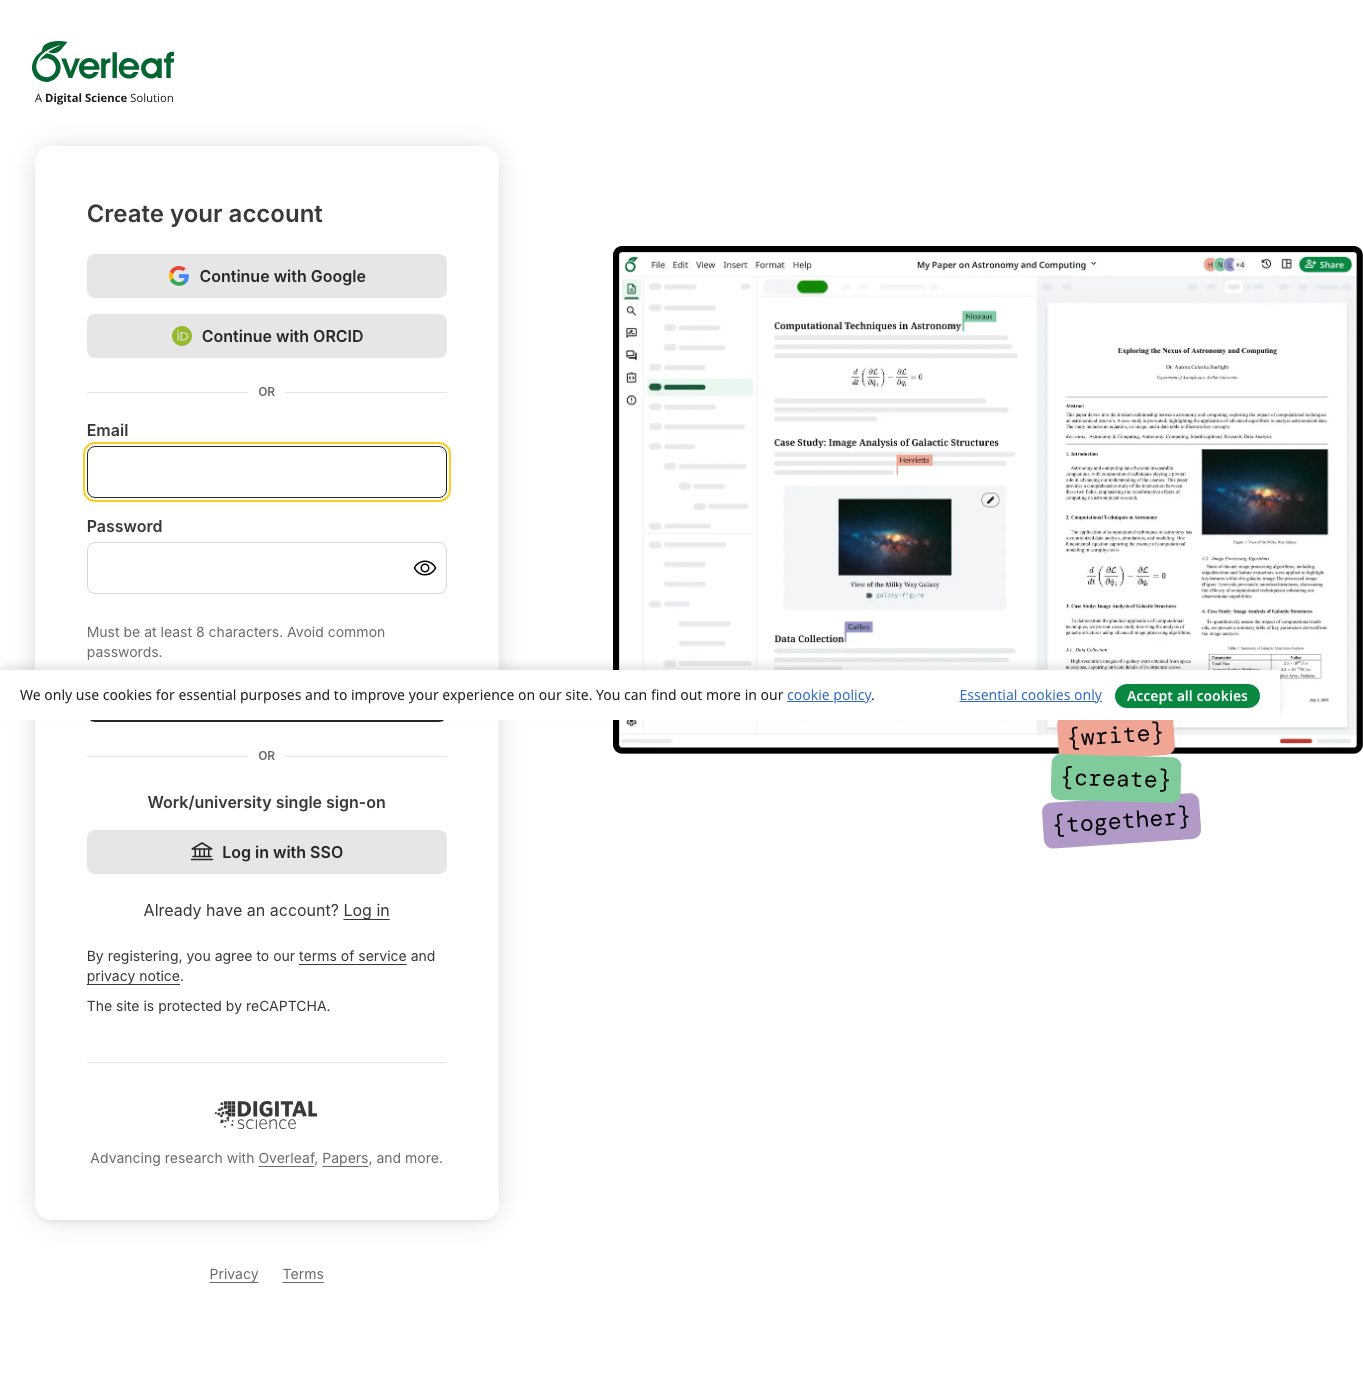
Go to overleaf.com and click Register. You can sign up with your university email (Google / ORCID also work). The free plan is sufficient for this course.
▲ Overleaf homepage — click Sign up (top right) to create a free account
2
Create a new blank project
After logging in, click New Project → Blank Project. Give it a name like ECON6083 Final Project.
▲ Click New Project → Blank Project to start from scratch
▲ Enter a project name, then click Create
3
The Overleaf interface
The interface has three panels:
- Left panel — File browser (your .tex files, images, .bib files)
- Middle panel — Code editor (where you type LaTeX)
- Right panel — PDF preview (updates when you compile)
The green Compile button (or Ctrl+Enter / Cmd+Enter) re-generates the PDF from your code.
▲ The Overleaf editor: file tree (left) · LaTeX source (centre) · PDF preview (right). Click Recompile to update the PDF.
Part 2 — Using the Course Template
We provide a ready-made LaTeX template for the final project report. Use this template — it already has the correct formatting, sections, and bibliography style.
1
Download the template
Download the template file: report.tex
The template already contains: document class settings, useful packages (amsmath, graphicx, natbib, booktabs), title/author placeholders, and section scaffolding.
2
Upload to Overleaf
In Overleaf, click New Project → Upload Project and upload the report.tex file (or zip it first if you have multiple files).
Alternatively, paste the template contents directly into a blank project's main.tex.
▲ Log in or register, then use New Project → Upload Project to upload report.tex
3
Compile and check
Press Compile. You should see a formatted PDF on the right. If there are errors, check the Logs panel (bottom of the editor) — it shows exactly which line caused the problem.
▲ After uploading and compiling, the PDF preview shows your formatted report
✅ If you see a PDF — you're ready to start writing!
Part 3 — Basic LaTeX Syntax
3.1 Document Structure
Every LaTeX document follows this skeleton:
\documentclass[12pt]{article}
\usepackage{amsmath}
\usepackage{graphicx}
\usepackage{natbib}
\usepackage{booktabs}
\title{My ECON6083 Final Project}
\author{Your Name}
\date{\today}
\begin{document}
\maketitle
\tableofcontents
\newpage
\end{document}
3.2 Text Formatting
| What you want | LaTeX command | Output |
|---|
| Bold text | \textbf{important} | important |
| Italic text | \textit{variable} | variable |
| Section heading | \section{Introduction} | 1. Introduction |
| Subsection | \subsection{Data} | 1.1 Data |
| New paragraph | Leave a blank line | Indented paragraph |
| Line break | \\ | New line |
| Footnote | \footnote{text here} | Footnote at page bottom |
3.3 Math Mode
LaTeX is famous for beautiful math. There are two modes:
The estimate is $\hat{\beta} = 2.3$ with standard error $0.4$.
\begin{equation}
Y_i = \alpha + \beta D_i + \gamma X_i + \varepsilon_i
\end{equation}
\[
\hat{\tau}^{DML} = \frac{1}{n}\sum_{i=1}^{n} \tilde{Y}_i \tilde{D}_i
\]
3.4 Common Math Commands
| Symbol / Structure | LaTeX |
|---|
| Fraction | \frac{numerator}{denominator} |
| Subscript | Y_{it} → Yit |
| Superscript | X^{2} → X² |
| Summation | \sum_{i=1}^{n} |
| Greek letters | \alpha \beta \gamma \delta \epsilon \theta \lambda \mu \sigma \tau |
| Hat (estimate) | \hat{\beta} |
| Bar (average) | \bar{Y} |
| Tilde (residual) | \tilde{Y} |
| Expected value | \mathbb{E}[Y] |
| Infinity | \infty |
| Approximately | \approx |
| Geq / Leq | \geq \leq |
| Indicator function | \mathbf{1}(\cdot) or \mathbb{1} |
3.5 Tables
For regression result tables, use the booktabs package (already in the template):
\begin{table}[htbp]
    \centering
    \caption{DML Estimates: Effect of 401(k) on Net Financial Assets}
    \begin{tabular}{lccc}
        \toprule
        Method & Estimate & Std. Error & 95\% CI \\
        \midrule
        OLS         & 9,416  & (523)   & [8,391, 10,441] \\
        Lasso DML   & 8,981  & (898)   & [7,221, 10,741] \\
        RF DML      & 9,204  & (1,012) & [7,221, 11,187] \\
        \bottomrule
    \end{tabular}
    \label{tab:dml}
\end{table}
💡 Tip: Use & to separate columns and \\ to end a row. \toprule, \midrule, \bottomrule give you professional-looking horizontal lines (from booktabs).
3.6 Figures
\begin{figure}[htbp]
    \centering
    \includegraphics[width=0.75\textwidth]{event_study.png}
    \caption{Event Study: Dynamic Treatment Effects (CS2021)}
    \label{fig:event_study}
\end{figure}
💡 Tip: Upload your image file (PNG/PDF/JPG) to Overleaf using the Upload button in the file panel. Then reference it by filename.
3.7 Citations & Bibliography
As shown by \citet{athey2021policy}, policy learning...
Results are consistent with the literature \citep{callaway2021diff}.
\bibliographystyle{aer}
\bibliography{references}
Your references.bib file contains entries like:
@article{athey2021policy,
  author  = {Athey, Susan and Wager, Stefan},
  title   = {Policy Learning with Observational Data},
  journal = {Econometrica},
  year    = {2021},
  volume  = {89},
  pages   = {133--161}
}
💡 Tip: Google Scholar → click "Cite" → BibTeX to get the .bib entry for any paper instantly.
Part 4 — Economics-Specific LaTeX
4.1 Regression Equations
\[
Y_{it} = \alpha_i + \lambda_t + \beta D_{it} + \varepsilon_{it}
\]
\[
Y_i = \theta D_i + g(X_i) + \varepsilon_i, \quad D_i = m(X_i) + \eta_i
\]
\[
ATT(g,t) = \mathbb{E}\bigl[Y_t(1) - Y_t(0) \mid G_g = 1\bigr]
\]
\[
\hat{\Gamma}_i = \hat{\tau}(X_i)
+ \frac{W_i\bigl(Y_i - \hat{\mu}_1(X_i)\bigr)}{\hat{e}(X_i)}
- \frac{(1-W_i)\bigl(Y_i - \hat{\mu}_0(X_i)\bigr)}{1 - \hat{e}(X_i)}
\]
4.2 Multi-line Aligned Equations
\begin{align}
    \hat{\beta}^{TWFE}
        &= \sum_{k,j} s_{kj} \cdot \hat{\beta}_{kj}^{2\times 2} \\
        &= \underbrace{0.3(4)}_{\text{Early vs Never}}
         + \underbrace{0.3(2)}_{\text{Late vs Never}}
         + \underbrace{0.2(-2)}_{\text{Forbidden!}}
         = 2.2
\end{align}
4.3 Professional Regression Table
\begin{table}[htbp]
\centering
\caption{Effect of Green Finance Zones on Patent Applications}
\begin{tabular}{lcccc}
    \toprule
     & (1) TWFE & (2) CS2021 & (3) DML-DiD & (4) SCM \\
    \midrule
    ATT          & 0.12**  & 0.21***  & 0.19***  & 0.22**  \\
                 & (0.06)  & (0.05)   & (0.04)   & (0.09)  \\
    \addlinespace
    Observations & 3,200   & 3,200    & 3,200    & 320     \\
    Covariates   & Linear  & DR       & ML       & None    \\
    \bottomrule
\end{tabular}
\begin{tablenotes}
    \small \textit{Note:} Standard errors in parentheses.
    *** p<0.01, ** p<0.05, * p<0.1.
\end{tablenotes}
\label{tab:main}
\end{table}
Part 5 — Common Errors & Fixes
❌ Error: "Undefined control sequence"
Cause: Typo in a LaTeX command, or a package is not loaded.
Fix: Check spelling. E.g. \textbf not \textbold. Add the required \usepackage{...} in the preamble.
❌ Error: "Missing $ inserted"
Cause: You used a math symbol (like _, ^, \alpha) outside of math mode.
Fix: Wrap math in $...$ or \[...\]. E.g. write $Y_{it}$ not Y_{it}.
❌ Citations showing as [?] or bold question marks
Cause: Bibliography hasn't been compiled yet.
Fix: You need to compile twice after adding new citations: Compile → Compile again. (Overleaf usually handles this automatically.)
❌ Figure not found / image missing
Cause: The image file isn't in the Overleaf project, or the filename is wrong (case-sensitive!).
Fix: Upload the image file to Overleaf. Make sure the filename in \includegraphics{...} matches exactly.
❌ Table/figure appearing in the wrong place
Cause: LaTeX places "floats" where it sees fit by default.
Fix: Use [h] (here), [t] (top), [b] (bottom), or [H] (force here, requires \usepackage{float}).
✅ General debugging tip: Click Logs at the bottom of the Overleaf editor. The error message shows the exact line number. Fix the first error first — later errors often disappear once the first is fixed.
5.1 Compiling bibliography step by step
1
Create a references.bib file
In Overleaf, click New File and name it references.bib. Paste your BibTeX entries here.
2
Add \bibliography{references} to your .tex file
Just before \end{document}, add:
\bibliographystyle{aer}
\bibliography{references}
3
Compile twice
Press Compile, wait for it to finish, then press Compile again. The second pass resolves citation cross-references.
Quick Reference Card
🗂 Most-Used LaTeX Commands at a Glance
Text
\textbf{bold}
\textit{italic}
\footnote{note}
\noindent
Structure
\section{Title}
\subsection{Sub}
\newpage
\tableofcontents
Math
$inline math$
\[ display math \]
\frac{a}{b}
\hat{\beta}, \bar{Y}
Tables
\begin{tabular}{lcc}
\toprule \midrule \bottomrule
& column separator
\\ row end
Figures
\includegraphics[width=.8\textwidth]{fig.png}
\caption{...}
\label{fig:name}
Citations
\cite{key}
\citet{key} (Author, year)
\citep{key} (Author, year)
\bibliography{refs}
Packages to know
\usepackage{amsmath}
\usepackage{graphicx}
\usepackage{booktabs}
\usepackage{natbib}
Greek letters
\alpha \beta \gamma \delta
\epsilon \theta \lambda \mu
\sigma \tau \pi \rho
\Gamma \Delta \Lambda \Sigma